
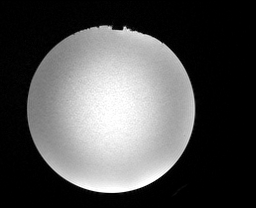
High resolution image of the fBIRN phantom
Why do you need quality assurance (QA) measures for fMRI?
The BOLD change for brain activation is often quite small (<1% or smaller). This means that the BOLD signal needs to be stable in order for you to detect these changes.
The stability of the image intensity is affected by:
- The subject (motion, cardiac and respiratory, CO2),
- The facility (RF and magnetic shield, humidity, and gradient cooling water temperature),
- The magnet (transmit and receive hardware and head coil).
The latter two items (#2 and #3) can be controlled and monitored to ensure your scanner is operating at its best. This can be done by imaging the fBIRN gel phantom. We recommend doing this every morning your facility is open to provide a record of performance. Careful monitoring can indicate when the system is out of specification before you notice the problem in your clinical images which increases your uptime.
What metrics should you measure?
We recommend using two BOLD runs of your typical fMRI protocol. The scanning time for each run should be at least 5 minutes. The BOLD QA can be done first thing every morning in addition to your normal QA measurement.
The metrics to quantify the stability of the MR system are:
Static SNR – This is the signal to noise of a region of interest (ROI) in the middle of the phantom. It measures the static signal strength.
Temporal SNR – This measures the static signal to noise over time. This is a direct measure of stability.
Signal Drift – This is the low frequency variation of the signal usually due to heating of the imaging gradients.
Standard Deviation of the mean – This is how variable the mean signal is over the time course.
%Fluctuation– This represents the standard deviation as a percentage of the mean signal. It provides a measure of the scanner noise. This needs to be smaller than the expected BOLD signal change.

Example BOLD volume showing all of the slices for a single time point

Analysis of phantom data showing the timecourse (top), the frequency spectrum (middle), and Weisskoff plot showing the impact of ROI size on noise
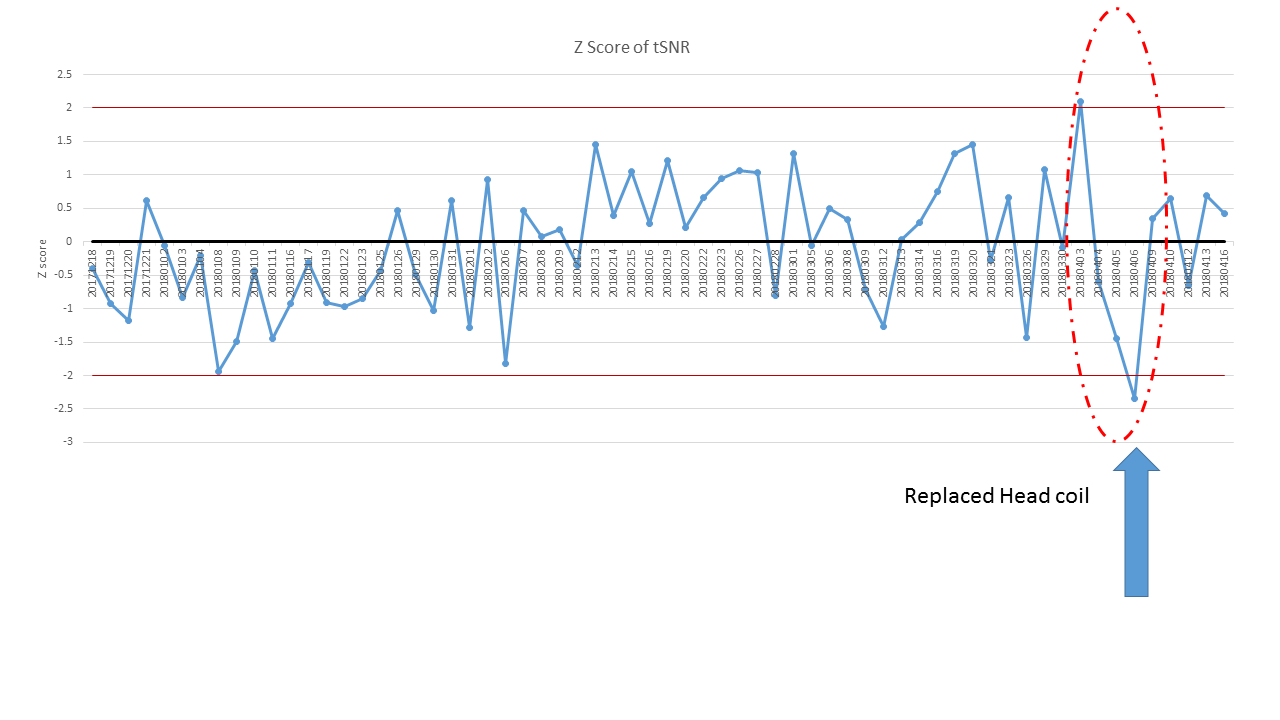
How QA can identify hardware problems